This article discusses some of the Java debugging techniques that are not so commonly used by developers. But I am sure, these are some powerful techniques which will help you for productive debugging.
All these techniques just use the out-of-box functionalities provided by Eclipse and Oracle JVM.
This article assumes that you are already aware of “Java remote debugging“. If not, I suggest you get familiar with “Java remote debugging” and to try it once. So that you will have the context set.
Further, the intention of the article is just to give you an idea of the possible techniques so that you can explore more about that.
Conditional Breakpoint
While debugging, Say you are interested in a particular element among n elements that you are iterating through. Or say you want to debug the behavior of a method when called with particular arguments(s). A simple option is having a debug point at a specific line and keep on waiting for iteration/method call to your value of interest. And the simplest way is Conditional Breakpoint.
You can tell eclipse to halt at the breakpoint only when the specific condition is met. You can rightclick on a breakpoint, go the “Breakpoint properties“, check the conditional and check box and enter the condition that need to be met to halt at the breakpoint.

Catching a swallowed up Exception
There might be times when exceptions are swallowed up unintentionally, without any log message. Or your application crashes without any clue, because of an Error. In both cases, you are left with no idea of what’s happening.
An easy way to catch such issue is to keep a class break point in the class java.lang.Exception or on all its constructors.
Or keep a class break point in the class java.lang.Error or on all its constructors.
You will hit the breakpoint when the mysterious exception/error occurs.
The rationale here is, JVM creates an instance of the Error/Exception when it occurs. We are taking it to our advantage to know when it happens.
Please be aware that, in an enterprise application, especially when you are using many frameworks, there will hell lot Exception instantiation and catch occurs. So do some research on when and where to enable the breakpoint, before using this approach.
Halting VM until the Debugger is Attached
Ever in a situation to debug a bootstrap module of an application? Or ever tried to race with the JVM execution to halt at a particular line of code before it gets executed.
You can very well use the parameter suspend=y as part of your debug parameters. This tells the JVM not to start executing the main class of your method until a debugger is attached.
Execute code with “Inspect”
Say you have given a big fix that involves code changes at multiple parts of the application and you have put breakpoints in some of those places and debugging it. While debugging you realize that you initialized a variable/attribute wrong.
You don’t have to change your code and restart the process of debugging. Instead,
- You can just write the expression in IDE to assign the right value to the variable/attribute.
- Select the expression, right click and give inspect. DONE!!!
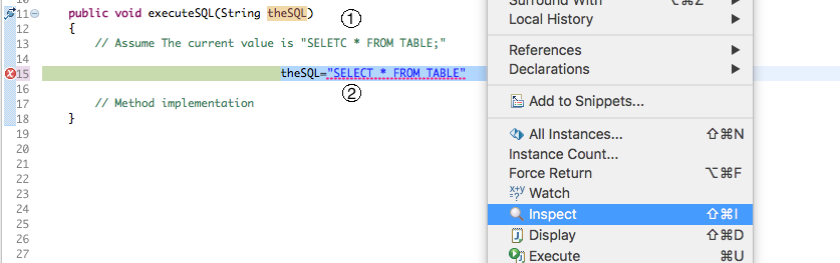
- Note the Typo in the variable theSQL
- Note the expression to correct the typo for current execution
Please note that,
- You are not changing the actual code here, you are just asking JVM to execute an expression currently, which in turn alters the variable/attribute. The change will only exist until the scope of the variable is valid or until the value is altered by existing code.
- Not just changing the value, you can execute any other valid expression such as logging.
- Against to conventional Java rules, using inspect, value of a final variable or even a private variable can be changed.
Hot Code Swap
How cool will it be when you can replace your code into a running JVM, without going through building, deployment and restart process. Of course it is possible with standard JVM from your eclipse.
While debugging, you realize that the implementation of the method has to be changed. To get it corrected,
- Keep the break point on the method and let the execution stop at that method.
- Now make the modifications and save the file.
- (If your eclipse is configured to build automatically,) The modified class will be buit and replaced in the running JVM. How sophisticated 🙂
Notes:
- Not all the changes are hot-code swappable in standard JVM. The changes to method definitions, without changing the method/class signature can only be swapped.
- Once the code swap happens, the execution starts from the beginning of the method at which the execution was halted before the swap. So please note that, when the method executes again, duplicate executions are possible.
- The swapped changes persist only in the currently running JVM. When the app stops and starts again, the changes will be gone.
Hope I have shared some of the useful debugging tips. Happy debugging!!!
